Elasticsearch / Kibana – Export logs 2/2
This is the second post about how to export application logs using Filebeat.
As in the previous post (), I’ll create a Pod with two containers, one for the fake application and the other for Filebeat, with the shared volume in the /var/logs folder. Likewise, the yaml files for the Pods and ConfigMaps are at: https://github.com/faustobranco/devops-db/tree/master/elasticsearch
This method has two differences. The first difference is that we won’t be using timestamped indexes/data streams, but rather unique indexes/data streams.
Some people prefer time-stamped indices, but I think it’s too confusing and requires a huge list of indices, among other things.
I wrote a post with these differences in Elasticsearch – Index x Data stream
The other, and most significant, difference is that I’ll be using custom fields in the log. By default, Elastic always places the entire string of the received log, regardless of how formatted it is, in a single message field.
The message field is text, and while it has its advantages, it has some disadvantages compared to keywords.
1. keyword
- Stores the exact value without tokenization.
- Ideal for fields used for filtering, aggregations, or exact term queries.
- Examples:
service,env,user,region,status_code. - Advantages:
- Fast for filtering and aggregations.
- Great for dashboards and visualizations.
- Efficient with low-to-moderate cardinality.
- Disadvantages:
- Cannot do full-text searches within the value.
- Large cardinality fields may consume more memory.
2. text
- The field is analyzed and tokenized, allowing full-text search like
matchormatch_phrase. - Ideal for free-form textual content, such as logs or messages.
- Examples:
message,description,comments. - Advantages:
- Enables sophisticated searches within the text.
- Supports linguistic analysis (stop words, stemming, etc.) if configured.
- Disadvantages:
- Slower for aggregations or exact filters.
- Not suitable for precise term aggregations; use a
.keywordsubfield instead.
Practical Recommendation for decode_json_fields
| Field | Suggested Type | Main Use |
|---|---|---|
service, env, user, region | keyword | Exact filtering and aggregations |
message | text | Full-text search within logs |
So, to illustrate, I’ll create a log with four more fields:
– “service”: {“type”: “keyword”},
– “env”: {“type”: “keyword”},
– “user”: {“type”: “keyword”},
– “region”: {“type”: “keyword”},
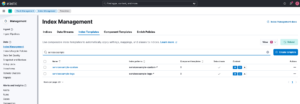
Now, this is where creating the Stream this way becomes a bit more laborious.
You’ll need to manually create an index template with the mappings for these fields. I’ll do this using curl:
curl -k -v -X PUT "https://elasticsearch.devops-db.internal:9200/_index_template/serviceexample-custom-template" \
  -H "Content-Type: application/json" \
  -u elastic:"3G+oOq0T_9tZ7oZM32d-" \
  -d '{
    "index_patterns": ["serviceexample-custom*"],
    "template": {
      "mappings": {
        "properties": {
          "@timestamp": {"type": "date"},
          "service":    {"type": "keyword"},
          "env":        {"type": "keyword"},
          "user":       {"type": "keyword"},
          "region":     {"type": "keyword"},
          "message":    {"type": "text"}
        }
      }
    },
  "data_stream": {
    "hidden": false,
    "allow_custom_routing": false
    }
  }'
The log that will be generated by the fake application is something like this:
{"@timestamp":"2025-09-25T09:28:50.%3NZ","message":"Teste log custom","service":"serviceexample-custom","user":"fbranco","region":"Portugal","env":"dev"}
{"@timestamp":"2025-09-25T09:28:51.%3NZ","message":"Teste log custom","service":"serviceexample-custom","user":"fbranco","region":"Portugal","env":"dev"}
{"@timestamp":"2025-09-25T09:28:52.%3NZ","message":"Teste log custom","service":"serviceexample-custom","user":"fbranco","region":"Portugal","env":"dev"}
{"@timestamp":"2025-09-25T09:28:53.%3NZ","message":"Teste log custom","service":"serviceexample-custom","user":"fbranco","region":"Portugal","env":"dev"}
{"@timestamp":"2025-09-25T09:28:54.%3NZ","message":"Teste log custom","service":"serviceexample-custom","user":"fbranco","region":"Portugal","env":"dev"}
{"@timestamp":"2025-09-25T09:28:55.%3NZ","message":"Teste log custom","service":"serviceexample-custom","user":"fbranco","region":"Portugal","env":"dev"}
{"@timestamp":"2025-09-25T09:28:56.%3NZ","message":"Teste log custom","service":"serviceexample-custom","user":"fbranco","region":"Portugal","env":"dev"}
{"@timestamp":"2025-09-25T09:28:57.%3NZ","message":"Teste log custom","service":"serviceexample-custom","user":"fbranco","region":"Portugal","env":"dev"}
{"@timestamp":"2025-09-25T09:28:58.%3NZ","message":"Teste log custom","service":"serviceexample-custom","user":"fbranco","region":"Portugal","env":"dev"}
{"@timestamp":"2025-09-25T09:28:59.%3NZ","message":"Teste log custom","service":"serviceexample-custom","user":"fbranco","region":"Portugal","env":"dev"}
Note that it is a formatted JSON and the fields/keys must be the same as those mapped in the Index Template.
Another important point, see that I explicitly declared that the index template is data_stream, so we should also create data_stream.
curl -k -s -v -u elastic:"3G+oOq0T_9tZ7oZM32d-" \ -X PUT \
  "https://elasticsearch.devops-db.internal:9200/_data_stream/serviceexample-custom"
Now, let’s create the configMap and start the POD.
kubectl apply -f config-map-custom.yaml
kubectl apply -f filebeat-test-custom.yaml
Check the logs:
kubectl logs filebeat-test-pod-custom -c filebeatImportantly, the Log is only sent to Elastic when it is larger than 1k.
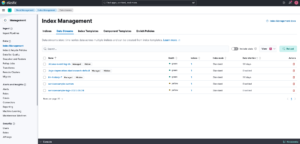
Now, in Kibana, look under Stack Management > Index Management > Data Streams and see that serviceexample-custom was created.
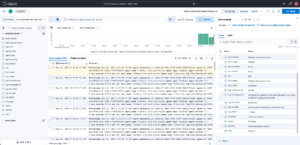
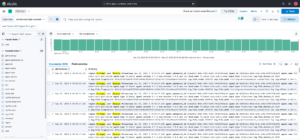
Once your logs are being sent, let’s go to Analytics > Discovery to see them.
Before that, we need to create a Data View for the index we created.
Before that, we need to create a Data View for the index we created.
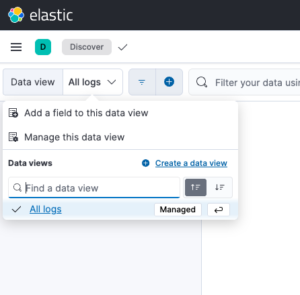
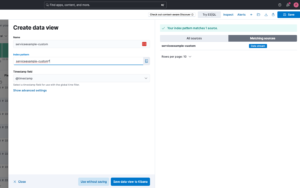
In the Data View combo box, click Create a Data View.
Next, enter a name for your Data View. In Index Pattern, enter the prefix of your index/data stream and a *. This is because whenever the index rotates, the date or number changes, hence the *.
In this case, serviceexample-custom will always be the prefix, and the date will always change. To read all dates, the * serves as a wildcard.
With this configured, you should now be able to see the logs in Kibana.
But see the big difference, in the log details, you can see the custom fields we created.