Elasticsearch / Kibana – Export logs 1/2
In this post, I’ll show you the first example of how to export logs from any application to Elastisearch using Filebeat.
To keep things simple, I’ll create a Pod with two containers: one simple container with a shell that appends log lines to a file in /var/log, and the other container with the Filebeat installation.
I’m using a ConfigMap for Filebeat configuration, but it’s up to you how you use it.
In my case, the two containers share the /var/log volume, so Filebeat can read the log files.
The yaml files for the Pods and ConfigMaps are at: https://github.com/faustobranco/devops-db/tree/master/elasticsearch
It is important to make clear that in this example, the entire log line will be inserted into the Message field.
In configMap, you basically have the filebeat.yaml file with the configuration below:
    filebeat.inputs:
    - type: filestream
      enabled: true
      paths:
        - /var/log/serviceexample/*.log
      multiline.pattern: '^[[:space:]]'
      multiline.negate: false
      multiline.match: after
      scan_frequency: 5s
      fingerprint:
        length: 16
        offset: 0

    output.elasticsearch:
      hosts: ["https://elasticsearch.devops-db.internal:9200"]
      username: "elastic"
      password: "3G+oOq0T_9tZ7oZM32d-"
      index: "serviceexample-logs-%{+yyyy.MM.dd}"
      ssl.verification_mode: none

    setup.template.name: "serviceexample-logs"
    setup.template.pattern: "serviceexample-logs-*"

    logging.level: info
    logging.to_files: true
    logging.files:
      path: /usr/share/filebeat/logs
      name: filebeat.log
      keepfiles: 7
      permissions: 0644
In the configMap, there’s basically the filebeat.yaml file with the following configuration: which folder Filebeat should look for logs in, the scan frequency, the Elasticsearch URL, username, and password, and the very important points:
- index: “serviceexample-logs-%{+yyyy.MM.dd}”
- setup.template.name: “serviceexample-logs”
- setup.template.pattern: “serviceexample-logs-*”
Although the Filebeat configuration specifies an index name like "serviceexample-logs-%{+yyyy.MM.dd}", it does not create a regular index directly. Instead:
- Index Template:
Thesetup.template.nameandsetup.template.patterndefine a composable index template in Elasticsearch. This template sets up the mapping, fields, and settings that any new data stream or index following this pattern will inherit. - Data Stream Creation:
When Filebeat starts sending logs, Elasticsearch creates a data stream namedserviceexample-logs-*(daily rollover happens if the pattern includes a date). The data stream manages the underlying time-based backing indices automatically. - Key Difference:
- Regular Index: User manually creates and manages the index.
- Data Stream: Elasticsearch automatically handles the index lifecycle (rollover, retention, aliasing), ensuring optimized storage and querying for time-series log data.
So, this configuration effectively sends logs to a data stream rather than a static index, even though the index field looks like a conventional index name. Elasticsearch – Index x Data stream
With that understood, let’s create the configMap and the POD:
kubectl apply -f config-map.yaml
kubectl apply -f filebeat-test.yaml

kubectl get pods
NAME                                                         READY   STATUS    RESTARTS   AGE
filebeat-test-pod                                            2/2     Running   0          85m
Note that the POD has two containers:
kubectl get pod filebeat-test-pod -o jsonpath='{.spec.containers[*].name}'

serviceexample filebeat
Check the logs:
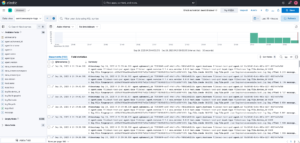
kubectl logs filebeat-test-pod -c filebeatImportantly, the Log is only sent to Elastic when it is larger than 1k.
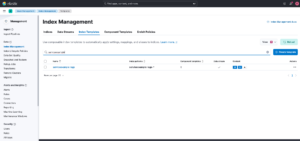
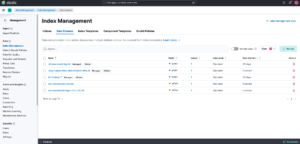
Now, in Kibana, look under Stack Management > Index Management > Data Streams and see that serviceexample-logs-2025.09.24 was created.
Once your logs are being sent, let’s go to Analytics > Discovery to see them.
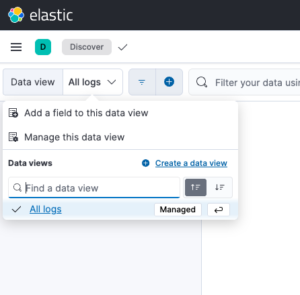
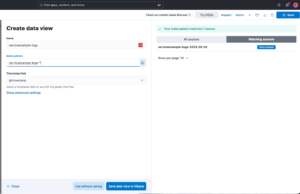
Before that, we need to create a Data View for the index we created.
Before that, we need to create a Data View for the index we created.
In the Data View combo box, click Create a Data View.
Next, enter a name for your Data View. In Index Pattern, enter the prefix of your index/data stream and a *. This is because whenever the index rotates, the date or number changes, hence the *.
In this case, serviceexample-logs- will always be the prefix, and the date will always change. To read all dates, the * serves as a wildcard.
With this configured, you should now be able to see the logs in Kibana.